pip install GraphvizRequirement already satisfied: Graphviz in c:\users\priya\appdata\local\programs\python\python310\lib\site-packages (0.20.3)
Note: you may need to restart the kernel to use updated packages.STOP DRAWING START CODING : Automating Architecture Diagrams with mingrammer/diagrams
Ever spent hours perfecting an architecture diagram, only to have one tiny system update throw everything off? Sounds frustrating, right? What if you could generate professional, scalable, and dynamic system diagrams, just by writing a few lines of Python code?
Welcome to mingrammer/diagrams—a powerful Python library that lets you create cloud, DevOps, and infrastructure diagrams effortlessly!
No more dragging and tweaking of shapes.
No more struggling with alignment.
No more outdated documentation.
With Diagrams, you can now turn your code into accurate, stunning and professional system diagrams within seconds. In this blog, we’ll explore the following areas:
Introduction to Diagrams
Installation setup
Core features
Advanced features
Real-world use cases
More references
Conclusion
Prerequisites
Python: This versatile programming language will serve as our trusty companion throughout the process. Ensure to install python version 3.7 or above.
Introduction
In early 2020, python library Diagrams was created by a Korean developer MinJae Kwon. This Python-based library allows developers to generate professional system diagrams with just few lines of code. With Diagrams, you can create AWS, GCP, Kubernetes, On-Prem, and SaaS infrastructure diagrams programmatically, making it an excellent tool for DevOps engineers, cloud architects, and system designers.
What is Diagrams?
Diagrams is an open-source Python library that allows you to generate architecture diagrams programmatically. Instead of dragging and dropping elements in a diagramming tool, you can write simple Python code to create cloud architecture, microservices, and DevOps pipeline diagrams.
What is “Diagrams as Code”?
The concept of “Diagrams as Code” refers to automating the process of diagram generation using code instead of manually designing visuals. Just like Infrastructure as Code (IaC) automates cloud provisioning, Diagrams as Code makes system documentation easier, scalable, and version-controlled.
| Aspect | Manual Approach | Diagrams as Code Approach |
|---|---|---|
| Creation Method | Manually design diagrams using Visio, Lucidchart, Draw.io | Write Python scripts to generate diagrams programmatically |
| Maintenance | Difficult to update and maintain when system changes | Easily editable and reusable—update with code changes |
| Accuracy | Prone to human errors and inconsistencies | Ensures precision and consistency |
| Collaboration | Hard to track changes in team projects | Version-controlled with GitHub/GitLab |
| Automation | No automation—manual updates required | Real-time updates with automated documentation |
Now let’s see how to install and setup Diagrams in Python
Before installing Diagrams you need to install:
Python 3.7+ (https://www.python.org/downloads/)
Graphviz
Graphviz (Graph Visualization Software) is an open-source tool used for generating diagrams and graphs from text-based descriptions. It is widely used for network diagrams, architecture visualization, dependency graphs, and flowcharts.
Why is Graphviz Important?
Required by Diagrams (mingrammer/diagrams) for rendering visuals.
Automatic layout generation (arranges nodes and edges efficiently).
Supports multiple formats (PNG, SVG, PDF, etc).
Integrates with Python, C, Java, etc.
To Install Graphviz:
Download and install Graphviz.
Add Graphviz to the system PATH variable. o Open System Properties . o Go to the Advanced tab then Click on the Environment Variables. o Under System Variables, find Path, click Edit. o Add the Graphviz bin directory path, which is usually: C: Files Then Click OK and restart your terminal.
Check that the Graphviz is installed by running the following code:
pip install GraphvizRequirement already satisfied: Graphviz in c:\users\priya\appdata\local\programs\python\python310\lib\site-packages (0.20.3)
Note: you may need to restart the kernel to use updated packages.dot -VIf Graphviz is installed correctly, you must see the output as follows:
dot - Graphviz version 2.49.3 (2025-02-22)To install Graphviz by using homebrew run the code:
brew install GraphvizTo check that the Graphviz is installed, run the code:
dot –VIf the output is as follows, then you have istalled Graphviz successfully!
dot - Graphviz version 2.49.3To install the Graphviz using package manager run the following code:
Code: sudo apt install Graphviz # Debian/Ubuntu
sudo yum install Graphviz # CentOS/RHEL
sudo pacman -S Graphviz # Arch Linux
To check if Graphviz is installed, run the code:
dot –VNow, you have successfully installed Graphviz! Let’s move on to install Diagram library using pip command.
Run the following code on the terminal:
pip install diagramsCollecting diagrams
Using cached diagrams-0.24.1-py3-none-any.whl.metadata (6.9 kB)
Requirement already satisfied: graphviz<0.21.0,>=0.13.2 in c:\users\priya\appdata\local\programs\python\python310\lib\site-packages (from diagrams) (0.20.3)
Requirement already satisfied: jinja2<4.0,>=2.10 in c:\users\priya\appdata\roaming\python\python310\site-packages (from diagrams) (3.1.5)
Requirement already satisfied: MarkupSafe>=2.0 in c:\users\priya\appdata\roaming\python\python310\site-packages (from jinja2<4.0,>=2.10->diagrams) (3.0.2)
Using cached diagrams-0.24.1-py3-none-any.whl (25.1 MB)
Installing collected packages: diagrams
Successfully installed diagrams-0.24.1
Note: you may need to restart the kernel to use updated packages.To upgrade to the latest version of this library run the code:
pip install --upgrade diagramsRequirement already satisfied: diagrams in c:\users\priya\appdata\local\programs\python\python310\lib\site-packages (0.24.1)
Requirement already satisfied: graphviz<0.21.0,>=0.13.2 in c:\users\priya\appdata\local\programs\python\python310\lib\site-packages (from diagrams) (0.20.3)
Requirement already satisfied: jinja2<4.0,>=2.10 in c:\users\priya\appdata\roaming\python\python310\site-packages (from diagrams) (3.1.5)
Requirement already satisfied: MarkupSafe>=2.0 in c:\users\priya\appdata\roaming\python\python310\site-packages (from jinja2<4.0,>=2.10->diagrams) (3.0.2)
Note: you may need to restart the kernel to use updated packages.To check if Diagrams is installed correctly, run the following code:
from diagrams import Diagram
from diagrams.aws.compute import EC2

with Diagram("Simple Diagram"):
    EC2("my server")
Here Simple Diagram is the name of the diagram.
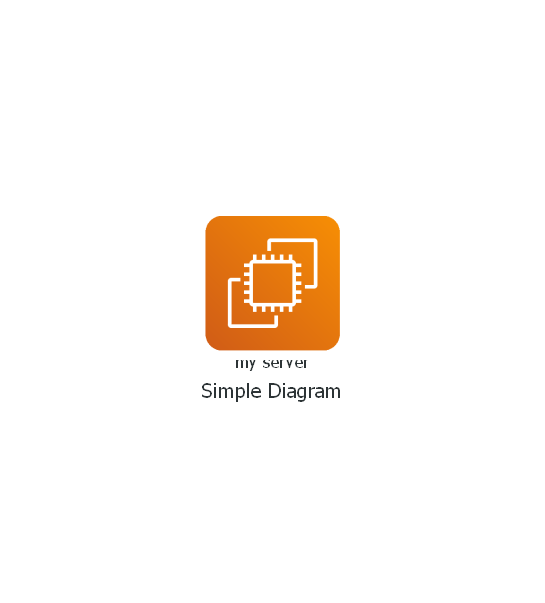
If Diagrams is installed successfully then this will generate an image file with single EC2 node drawn as simple_diagram.png in your working directory and open that created image file immediately.
Core Features
The diagrams library consists of four basic things:
1. Diagram: This acts as the main container that holds all the elements of your architecture visualization. Think of it as a blueprint where you define configurations for your diagram. However, in most cases, all you need to do is provide a name for your diagram. You can create a diagram context with the Diagram class. The first parameter of the Diagram constructor will be used to generate the output filename.
2. Nodes: Once we define the Diagram context, the next step is to add Nodes, which are the fundamental elements that represent different services and components in your architecture. A Node can be any resource in the system such as:
An EC2 instance
A Lambda function
An SQS queue
A Jenkins job, etc.
Each Node belongs to a specific package within the Diagrams library. You can import them as needed. All these nodes can be assigned to variables as well.
Let’s understand how to use Nodes?
Nodes are imported from different provider categories, such as diagrams.aws.compute, diagrams.onprem.database, etc. A node object consists of three parts: provider, resource type and name. Here is a simple example:
from diagrams import Diagram
from diagrams.aws.compute import EC2

with Diagram("Simple Diagram"):
    EC2("web")
In this example, EC2 is a node of resource type compute which is provided by the aws provider. Other node objects can also used in similar manner.
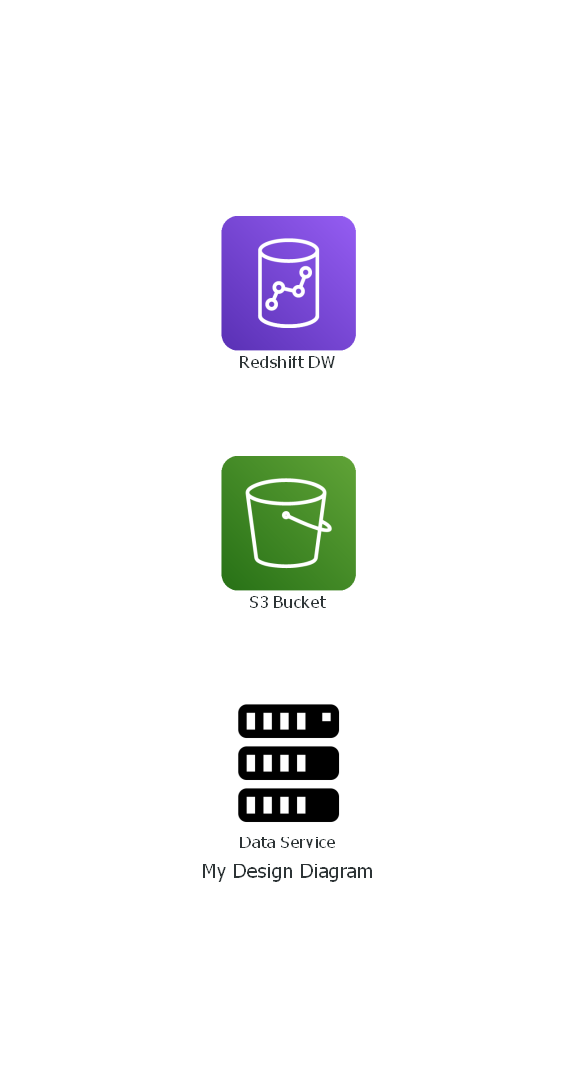
from diagrams import Diagram
from diagrams.aws.storage import S3
from diagrams.onprem.compute import Server
from diagrams.aws.analytics import Redshift

with Diagram("My Design Diagram") :
    DataService = Server("Data Service")

    S3Storage = S3("S3 Bucket")

    MasterDB = Redshift("Redshift DW")
This code snippet will generate this:
Other node objects can also used in similar manner.
# aws resources
from diagrams.aws.compute import ECS, Lambda
from diagrams.aws.database import RDS, ElastiCache
from diagrams.aws.network import ELB, Route53, VPC
...

# azure resources
from diagrams.azure.compute import FunctionApps
from diagrams.azure.storage import BlobStorage
...

# alibaba cloud resources
from diagrams.alibabacloud.compute import ECS
from diagrams.alibabacloud.storage import ObjectTableStore
...

# gcp resources
from diagrams.gcp.compute import AppEngine, GKE
from diagrams.gcp.ml import AutoML
...

# k8s resources
from diagrams.k8s.compute import Pod, StatefulSet
from diagrams.k8s.network import Service
from diagrams.k8s.storage import PV, PVC, StorageClass
...

# oracle resources
from diagrams.oci.compute import VirtualMachine, Container
from diagrams.oci.network import Firewall
from diagrams.oci.storage import FileStorage, StorageGateway
****DataFlow****
Data flow can be represented by connecting the nodes with the operators >>, <<, and -.
>> connects nodes in left to right direction.
<< connects nodes in right to left direction.
- connects nodes in no direction. Undirected.
from diagrams import Diagram
from diagrams.aws.compute import EC2
from diagrams.aws.database import RDS
from diagrams.aws.network import ELB
from diagrams.aws.storage import S3

with Diagram("Web Services", show=False):
    ELB("lb") >> EC2("web") >> RDS("userdb") >> S3("store")
    ELB("lb") >> EC2("web") >> RDS("userdb") << EC2("stat")
    (ELB("lb") >> EC2("web")) - EC2("web") >> RDS("userdb")
Note: Be careful when using ‘-’ and any shift operators together. It can cause unexpected results due to Python’s operator precedence, so you might have to use parentheses.
The Data Flow direction can be changed with the direction parameter. The default is LR.
Allowed values are: TB, BT, LR, and RL
from diagrams import Diagram
from diagrams.aws.compute import EC2
from diagrams.aws.database import RDS
from diagrams.aws.network import ELB

with Diagram("Workers", show=False, direction="TB"):
    lb = ELB("lb")
    db = RDS("events")
    lb >> EC2("worker1") >> db
    lb >> EC2("worker2") >> db
    lb >> EC2("worker3") >> db
    lb >> EC2("worker4") >> db
    lb >> EC2("worker5") >> db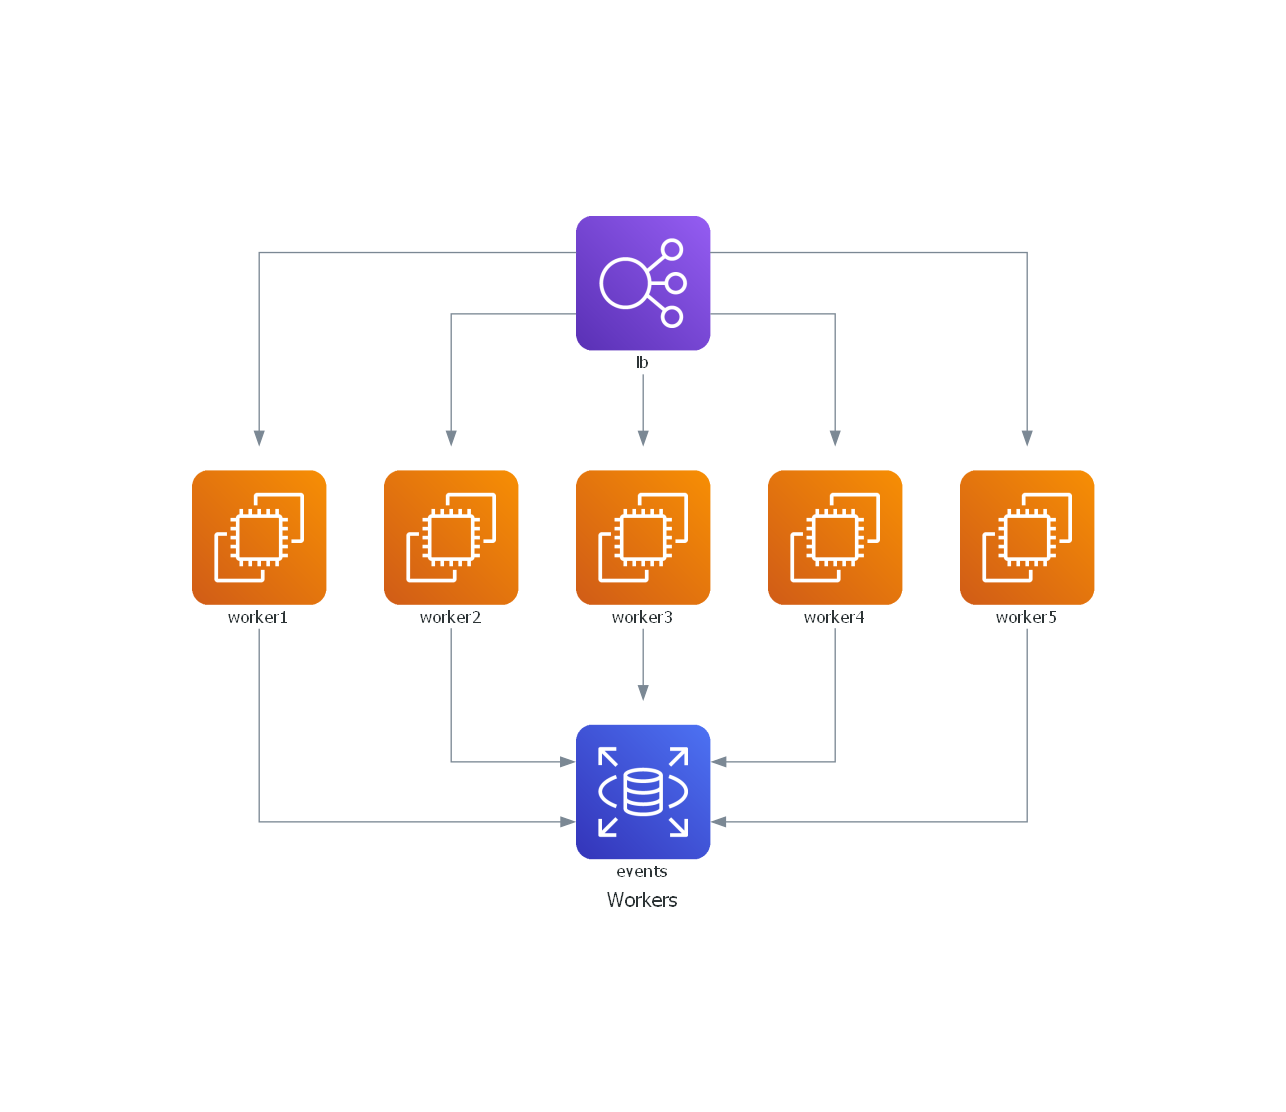
****Group Data Flow****
To avoid too many reduntant flows, you can group nodes into a list so that all nodes are connected to other nodes at once:
from diagrams import Diagram
from diagrams.aws.compute import EC2
from diagrams.aws.database import RDS
from diagrams.aws.network import ELB

with Diagram("Grouped Workers", show=False, direction="TB"):
    ELB("lb") >> [EC2("worker1"),
                  EC2("worker2"),
                  EC2("worker3"),
                  EC2("worker4"),
                  EC2("worker5")] >> RDS("events")
Note: You can’t connect two lists directly because shift/arithmetic operations between lists are not allowed in Python.
3. Cluster: A cluster is nothing but a set of nodes that we want together. A cluster is defined using the cluster context and any node defined under that context is grouped together. You can also give it a name to define your cluster group. You can also nest clusters under clusters.
from diagrams import Cluster, Diagram
from diagrams.aws.compute import ECS
from diagrams.aws.database import RDS
from diagrams.aws.network import Route53

with Diagram("Simple Web Service with DB Cluster", show=False):
    dns = Route53("dns")
    web = ECS("service")

    with Cluster("DB Cluster"):
        db_primary = RDS("primary")
        db_primary - [RDS("replica1"),
                     RDS("replica2")]

    dns >> web >> db_primary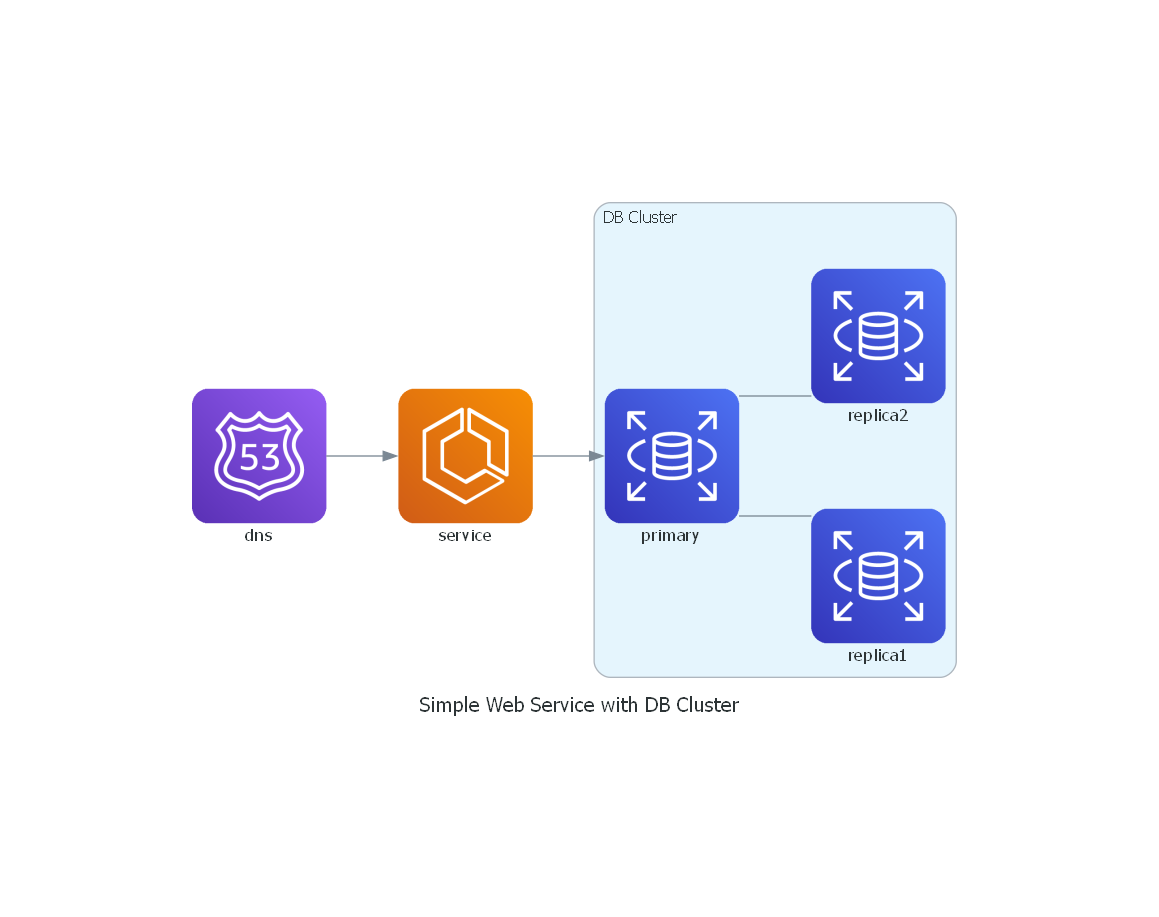
****Nested Cluster:****
from diagrams import Cluster, Diagram
from diagrams.aws.compute import ECS, EKS, Lambda
from diagrams.aws.database import Redshift
from diagrams.aws.integration import SQS
from diagrams.aws.storage import S3

with Diagram("Event Processing", show=False):
    source = EKS("k8s source")

    with Cluster("Event Flows"):
        with Cluster("Event Workers"):
            workers = [ECS("worker1"),
                       ECS("worker2"),
                       ECS("worker3")]

        queue = SQS("event queue")

        with Cluster("Processing"):
            handlers = [Lambda("proc1"),
                        Lambda("proc2"),
                        Lambda("proc3")]

    store = S3("events store")
    dw = Redshift("analytics")

    source >> workers >> queue >> handlers
    handlers >> store
    handlers >> dw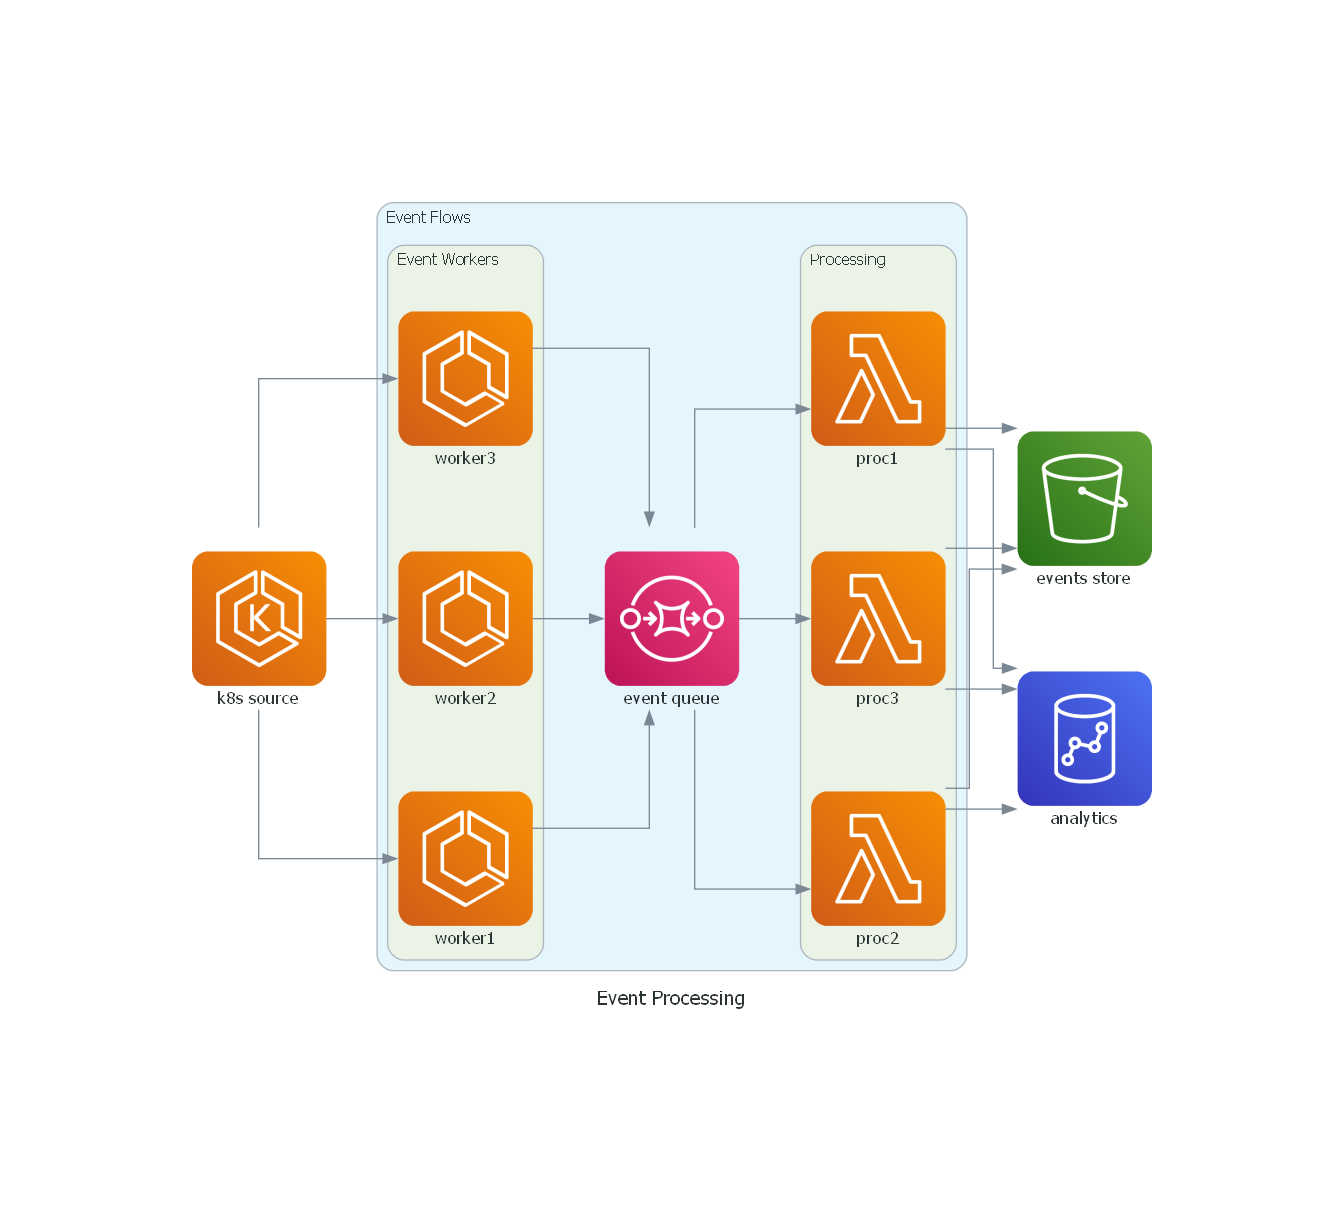
4. Edge: Edge is an object representing a connection between nodes with some additional properties.You can set the colour, label, and style of your edge that connects your nodes. An edge object contains three attributes: label, color, and style. They mirror the corresponding Graphviz edge attributes.
from diagrams import Diagram, Edge
from diagrams.aws.storage import S3
from diagrams.onprem.compute import Server
from diagrams.aws.analytics import Redshift

with Diagram("My Design Diagram") :
    DataService = Server("Data Service")

    S3Storage = S3("S3 Bucket")

    MasterDB = Redshift("Redshift DW")

    DataService >> Edge(label="Sending data to S3") >> S3Storage
    S3Storage >> Edge(label="Copying data to Redshift") >> MasterDB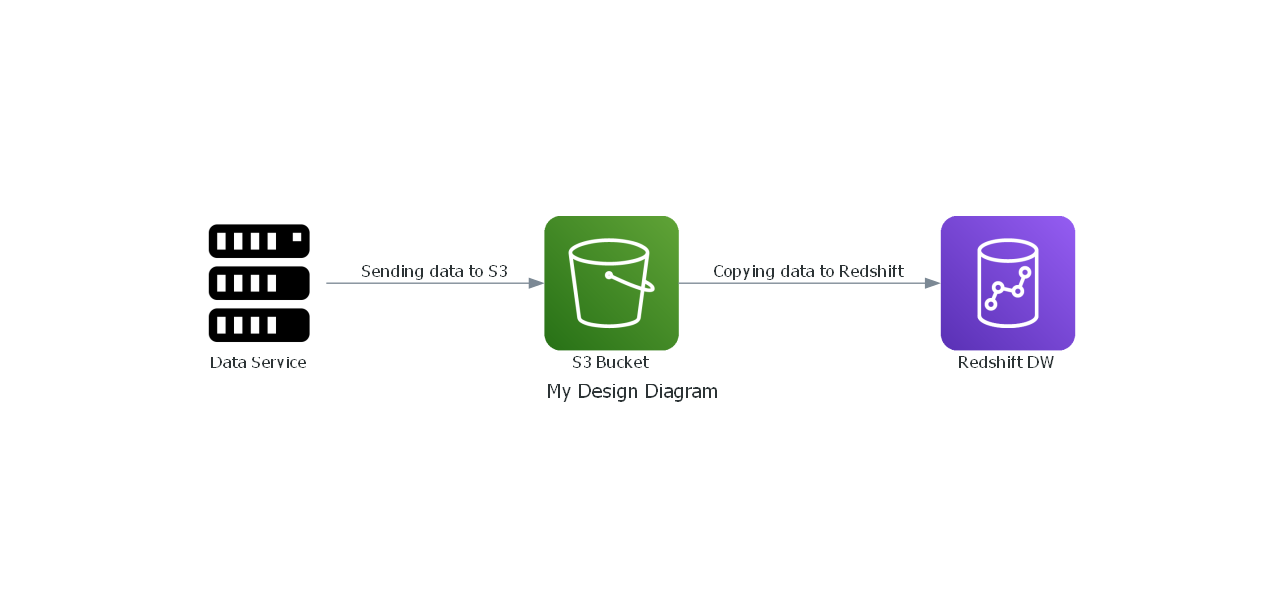
from diagrams import Cluster, Diagram, Edge
from diagrams.onprem.analytics import Spark
from diagrams.onprem.compute import Server
from diagrams.onprem.database import PostgreSQL
from diagrams.onprem.inmemory import Redis
from diagrams.onprem.aggregator import Fluentd
from diagrams.onprem.monitoring import Grafana, Prometheus
from diagrams.onprem.network import Nginx
from diagrams.onprem.queue import Kafka

with Diagram(name="Advanced Web Service with On-Premises (colored)", show=False):
    ingress = Nginx("ingress")

    metrics = Prometheus("metric")
    metrics << Edge(color="firebrick", style="dashed") << Grafana("monitoring")

    with Cluster("Service Cluster"):
        grpcsvc = [
            Server("grpc1"),
            Server("grpc2"),
            Server("grpc3")]

    with Cluster("Sessions HA"):
        primary = Redis("session")
        primary \
            - Edge(color="brown", style="dashed") \
            - Redis("replica") \
            << Edge(label="collect") \
            << metrics
        grpcsvc >> Edge(color="brown") >> primary

    with Cluster("Database HA"):
        primary = PostgreSQL("users")
        primary \
            - Edge(color="brown", style="dotted") \
            - PostgreSQL("replica") \
            << Edge(label="collect") \
            << metrics
        grpcsvc >> Edge(color="black") >> primary

    aggregator = Fluentd("logging")
    aggregator \
        >> Edge(label="parse") \
        >> Kafka("stream") \
        >> Edge(color="black", style="bold") \
        >> Spark("analytics")

    ingress \
        >> Edge(color="darkgreen") \
        << grpcsvc \
        >> Edge(color="darkorange") \
>> aggregator.png)
Now, let’s move forward to understand the relationships between Nodes.
Directed Relationship: This means a node is pointing towards the next one. Without using edge, you can just use the “>>” operator for this and an arrow will be created between your nodes.
Synergic Relationship: This is to define nodes that work together as a single unit. You can define this by using the “-” operator between nodes.
from diagrams import Diagram, Edge, Cluster
from diagrams.aws.storage import S3
from diagrams.onprem.compute import Server
from diagrams.aws.analytics import Redshift
from diagrams.aws.compute import LambdaFunction as Lambda

with Diagram("My Design Diagram") :
    DataService = Server("Data Service")

    with Cluster('S3 Buckets') :
        S3Storage = [S3(f"S3 Bucket_{n}") for n in range(1,4)]

    with Cluster('Lambda Process'):
        Lambdas = [Lambda(f"LambdaFunction_{n}") for n in range(1,4)]

        for n in range(0,2):
            Lambdas[n] - Lambdas[n+1]


    MasterDB = Redshift("Redshift DW")

    DataService >> Edge(label="Sending data to S3") >> S3Storage
    S3Storage >> Edge(label="Copying data to Redshift") >> MasterDB
    MasterDB >> Lambdas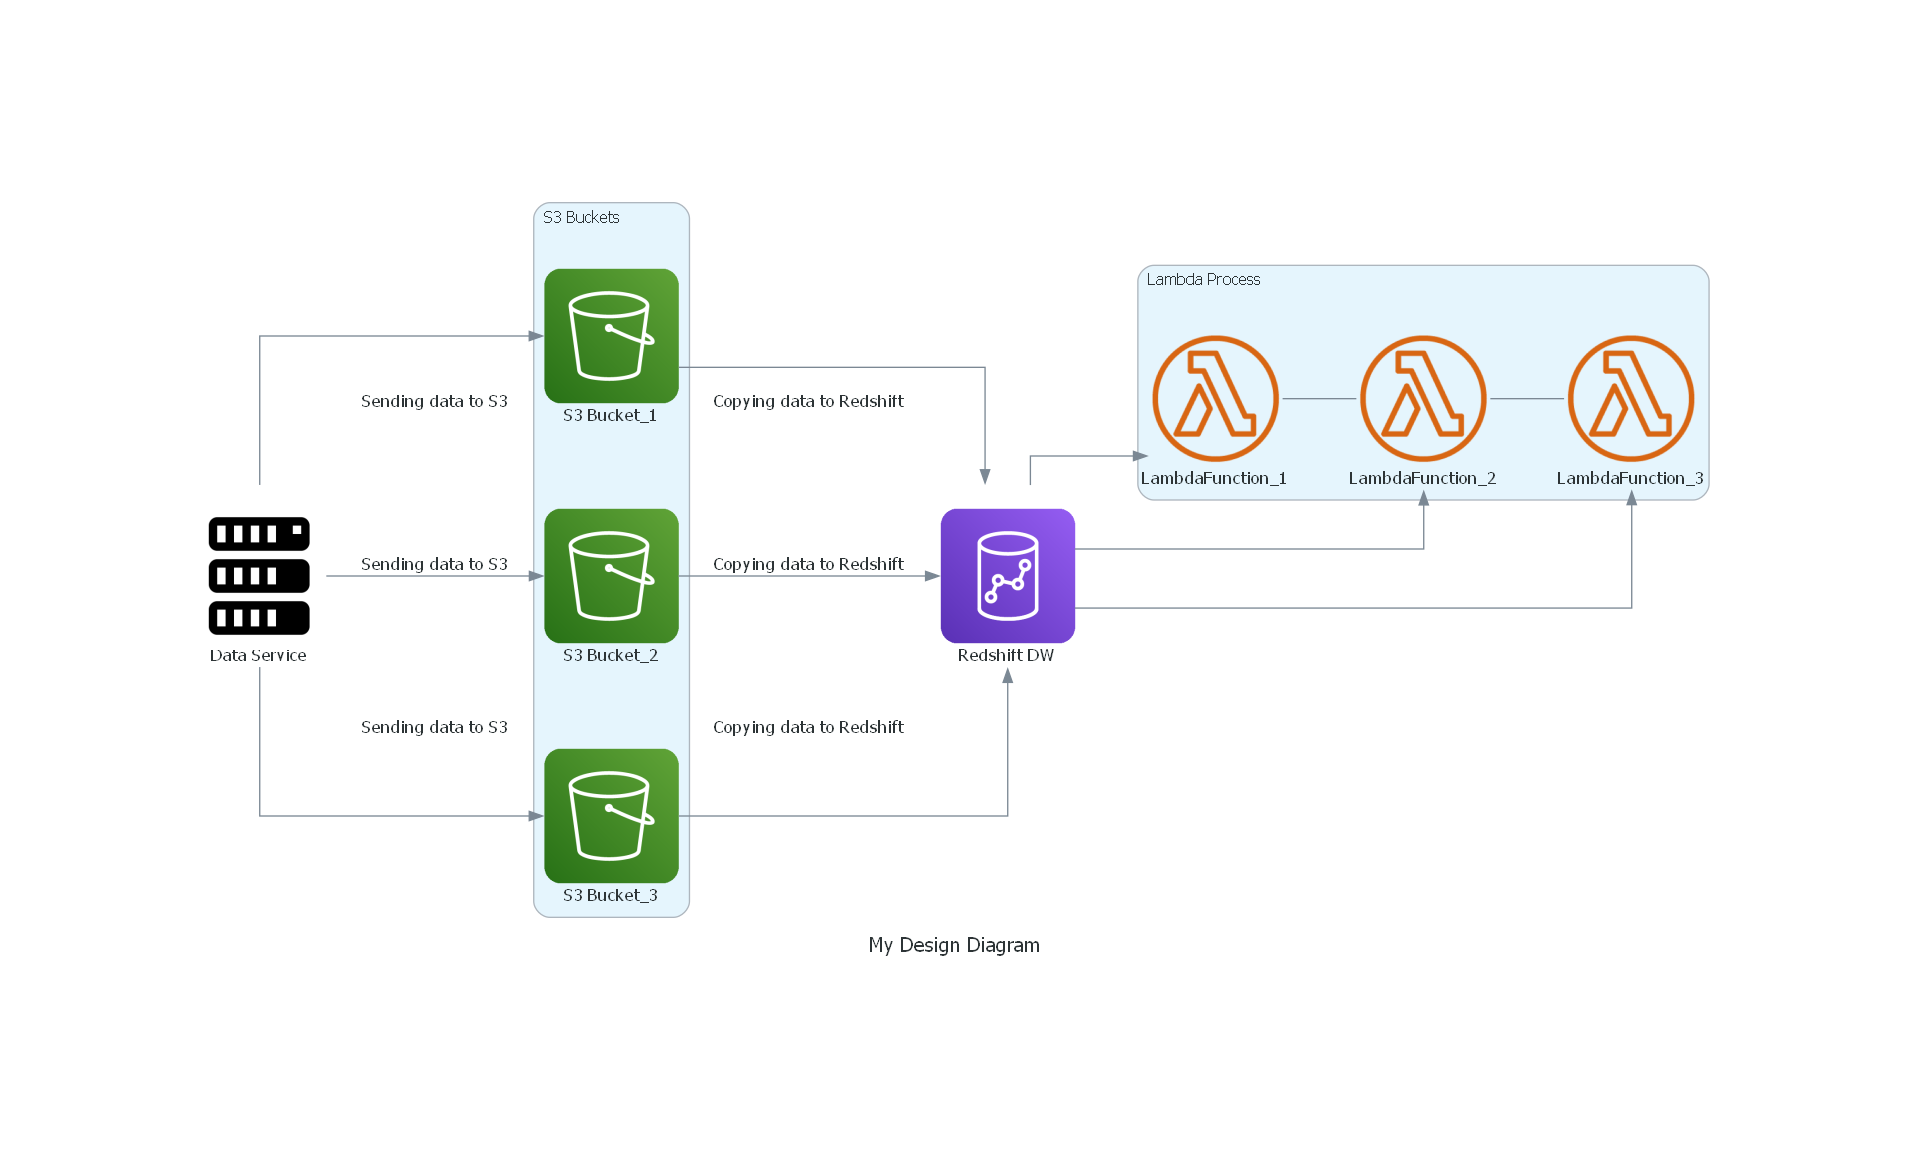
Here we have defined the relationship between the lambda function using the ‘-’ operator and so they are now in synergic relationshi and work together inside the cluster. It can be seen from here that how the Redshift DW directed to the Lambda functions without any text defining a directed relationship by just using the ‘>>’ operator without any Edge.
Advanced Features & Customizations
Now that you’ve covered the basics (Diagram, Nodes, Edges, Clusters, and Relationships), let’s introduce more customization options. One of the standout features of the Diagrams library is its simple and intuitive Python syntax.Diagrams allows users to define infrastructure, system architecture, and cloud diagrams using concise Python code. These are the key features of the Diagram library:
1. Customizing Node Styles: Diagrams allow you to customize node styles, including color, shape, and icons, to enhance clarity and visual appeal.
from diagrams import Diagram
from diagrams.aws.compute import EC2
from diagrams.aws.database import RDS
from diagrams.aws.network import ELB

with Diagram("Custom Styled Nodes", show=True, direction="TB"):
    lb = ELB("Load Balancer")  # Default AWS icon
    web = EC2("Web Server")  # EC2 icon
    db = RDS("Database")  # Database icon

    lb - [web] - db  # Defining connections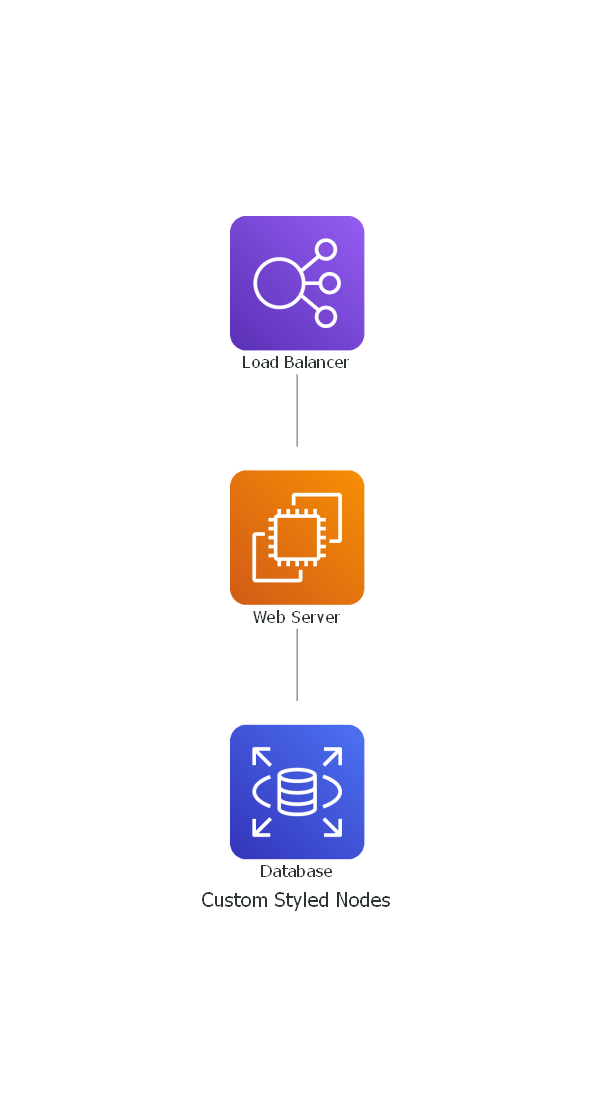
2. Using Subgraphs for Better Organization: Subgraphs (Clusters) help group related components in a diagram, making it easier to understand complex systems.
from diagrams import Diagram, Cluster
from diagrams.aws.compute import EC2
from diagrams.aws.database import RDS
from diagrams.aws.network import ELB

with Diagram("Grouped Architecture", show=True, direction="TB"):
    lb = ELB("Load Balancer")

    with Cluster("Application Servers"):
        web1 = EC2("Web Server 1")
        web2 = EC2("Web Server 2")

    db = RDS("Database")

    lb - [web1, web2] - db  # Connecting nodes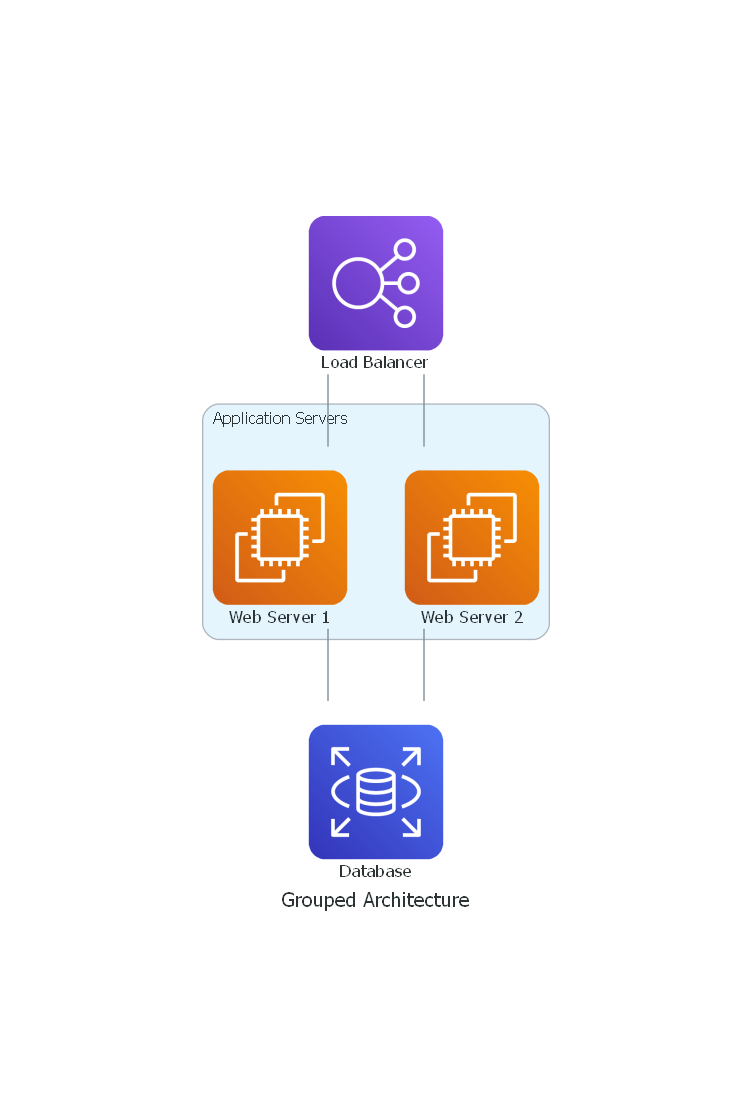
3. Arranging Layouts: By default, Diagrams arranges components top to bottom (TB), but you can customize it using direction attributes:
TB (Top to Bottom)
LR (Left to Right)
BT (Bottom to Top)
RL (Right to Left)
Example : Left-to-Right (LR) Layout
from diagrams import Diagram
from diagrams.aws.compute import EC2
from diagrams.aws.database import RDS
from diagrams.aws.network import ELB

with Diagram("Left to Right Layout", direction="LR", show=True):
    lb = ELB("Load Balancer")
    web = EC2("Web Server")
    db = RDS("Database")

    lb >> web >> db  # Flow from left to right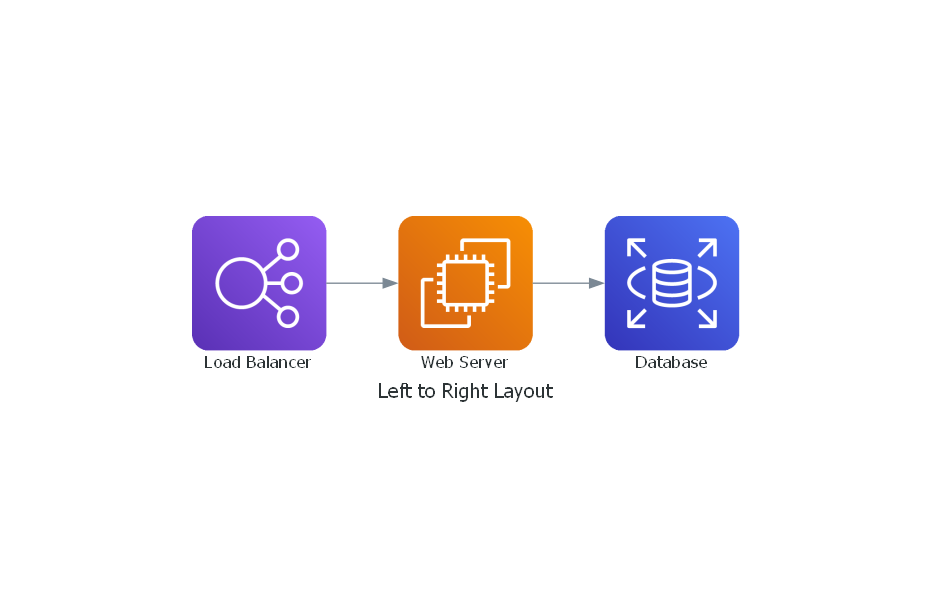
4. Adding Custom Icons and Images: By default, Diagrams uses built-in icons, but you can use custom images for non-supported components.
from diagrams import Diagram
from diagrams.custom import Custom

with Diagram("Custom Icon Example", show=True):
my_service = Custom("My Service", "./my_icon.png")![]()
5. Defining Complex Relationships (Bidirectional & Conditional Arrows): This helps represent data flow, feedback loops, and interdependencies.
from diagrams import Diagram
from diagrams.aws.compute import EC2
from diagrams.aws.database import RDS
from diagrams.aws.network import ELB

with Diagram("Complex Relationships", show=True):
    lb = ELB("Load Balancer")
    web = EC2("Web Server")
    db = RDS("Database")

    lb >> web  # One-way connection
    web >> db  # One-way connection
    db << web  # Bidirectional connection (data flow)
6. Using Different Providers (AWS, GCP, Azure, On-Premises): Diagrams supports multiple cloud providers and on-premises infrastructure.
from diagrams import Diagram
from diagrams.aws.compute import EC2
from diagrams.azure.compute import AppServices
from diagrams.gcp.compute import GCE
from diagrams.onprem.database import PostgreSQL

with Diagram("Multi-Cloud Setup", show=True):
    aws_vm = EC2("AWS EC2")
    azure_func = AppServices("Azure App Service")
    gcp_vm = GCE("GCP Compute Engine")
    onprem_db = PostgreSQL("On-Prem Database")

    aws_vm >> azure_func >> gcp_vm >> onprem_db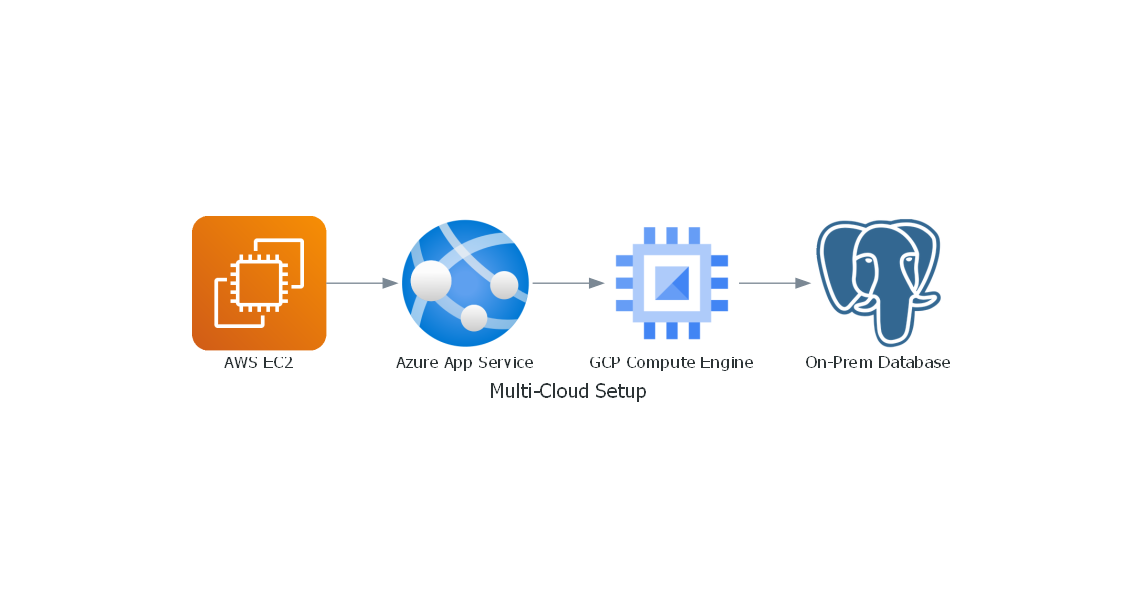
7. Prebuilt Cloud and On-Prem Components : The Diagrams library provides prebuilt cloud and on-prem components that allow users to easily create infrastructure diagrams without designing custom icons or shapes. These components represent various cloud services, networking elements, storage, databases, and security tools from providers like AWS,Azure, Google Cloud, and on-prem architectures.
| Category | Supported Services |
|---|---|
| Cloud Providers | AWS, Azure, GCP, OpenStack, Alibaba Cloud |
| DevOps Tools | Kubernetes, Terraform, Jenkins, GitHub Actions |
| Networking | Cisco, F5, Juniper routers and firewalls |
| On-Premise | Generic servers, databases, load balancers |
8. Exporting and Saving Diagrams: Once you create a diagram using the Diagrams(mingrammer/diagrams) library, you may need to export, save, or share it in different formats. The library automatically generates an image file when the diagram script runs, but you can customize the output file format,location, and visualization options. Example: Save as SVG
from diagrams import Diagram
from diagrams.aws.compute import EC2

with Diagram("Custom_Diagram", filename="my_diagram", outformat="svg"):
    EC2("Web Server")
Summary of Advanced Features
| Feature | Description & Use Case |
|---|---|
| Custom Icons | Use custom images for branding or non-supported tools. |
| Relationships | Define one-way, bidirectional, and feedback loop connections. |
| Multi-Cloud Support | Connect AWS, Azure, GCP, and on-prem services. |
| Exporting Diagrams | Save diagrams as PNG, SVG, PDF, or JPG. |
| CI/CD Integration | Automate diagram generation in pipelines. |
Best Practices & Tips for Creating Diagrams:
Keep it Simple – Avoid overcrowding diagrams with unnecessary components.
Use Clusters – Organize diagrams into meaningful groups.
Label Components Properly – Use descriptive names for better clarity.
Use Version Control – Store diagrams in GitHub to track changes over time.
Optimize Layouts – Choose the best direction (TB, LR, RL, BT) for readability.
Real world Use-Cases
1. Cloud Architecture Visualization - Helps in designing and documenting cloud architectures across platforms like AWS, GCP, Azure, Kubernetes, Alibaba Cloud and Oracle Cloud.
Example – Generates AWS network topology diagrams programmatically.
Benefits: Automates cloud architecture documentation, ensuring up-to-date diagrams.
2. Software System Design - Engineers and architects can expertly create flowcharts for software modules, microservices, and APIs.
Example: Clearly representing data flow in a microservices-based application.
Benefits: Provides clear system design documentation.
3. Hybrid Cloud and Multi-Cloud Architecture - Helps architects visualize hybrid cloud (on-prem + cloud) and multi-cloud (AWS + GCP + Azure) environments.
Example: Hybrid cloud infrastructure with AWS and on-premises resources.
Benefits: Helps organizations design failover and disaster recovery plans.
4. Security Architecture Visualization - Useful for compliance and security reviews (ISO, NIST, SOC2). - - Example: Security Architecture for a Web Application. - - Benefits: Helps organizations comply with security policies and audits (ISO, SOC2, NIST).
References
URL: https://github.com/mingrammer/diagrams
Description: Official GitHub repository with source code, examples, and documentation.
URL: https://diagrams.mingrammer.com
Description: Official documentation explaining installation and usage.
Conclusion:
Challenges:
Requires basic Python knowledge for scripting diagrams.
Limited styling options compared to UI-based tools.
Unlike Google Drawings or Miro, diagrams lacks real-time team collaboration features.